Description
Proven Technique and Reliability
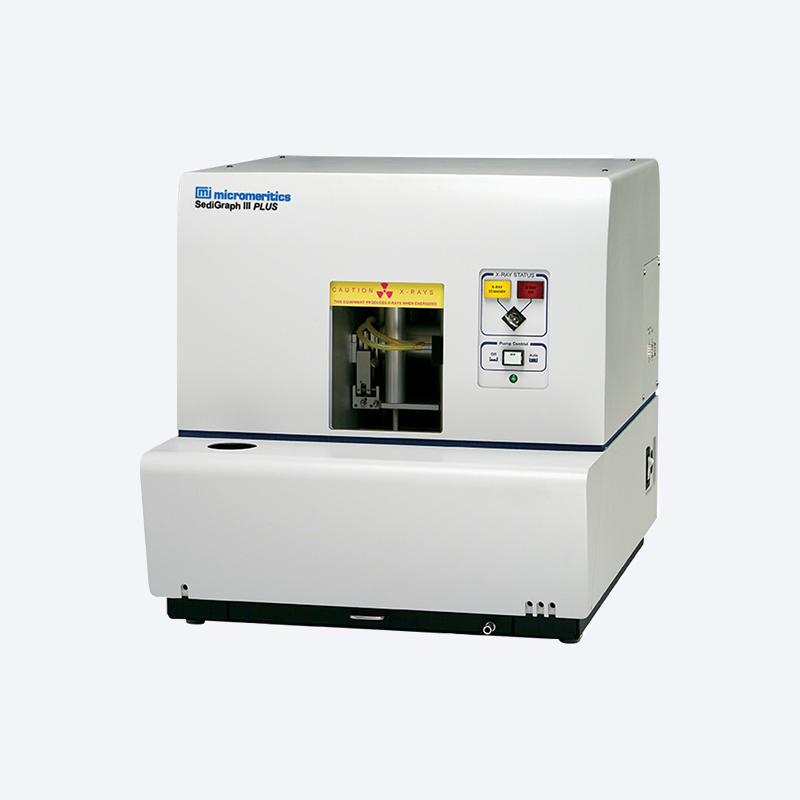
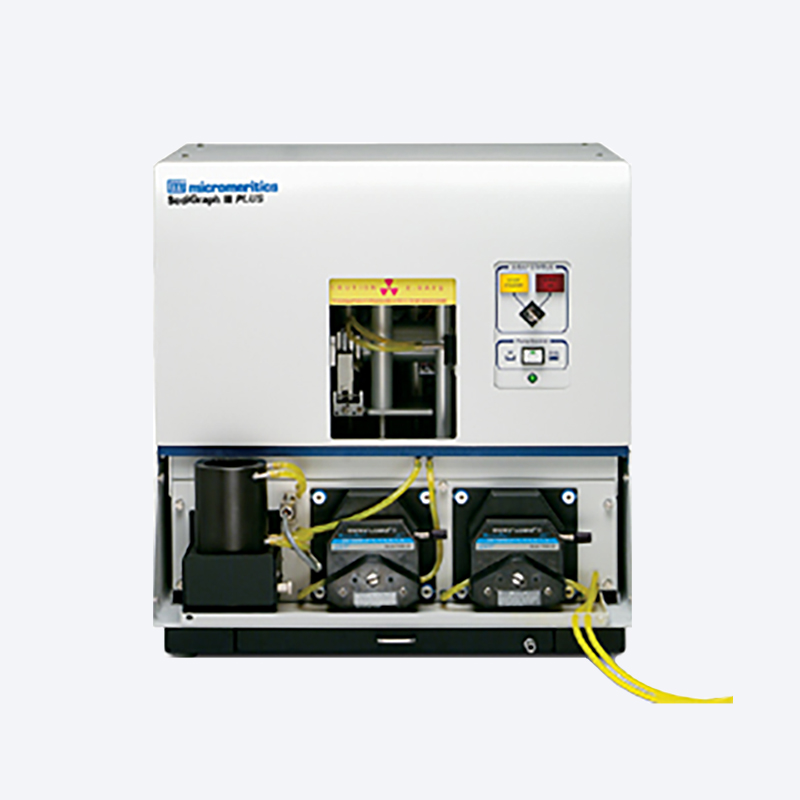
For over three decades, the Micromeritics SediGraph has remained the standard instrument for particle size analysis in many laboratories throughout the world. Whether in a rugged production environment or a controlled laboratory setting, the SediGraph continues to produce accurate results with superior reliability. Particle size distribution is measured using the sedimentation method. Particle mass is measured directly via X-ray absorption. By measuring the rate at which particles fall under gravity through a liquid having known properties as described by Stokes’ law, the SediGraph determines the equivalent spherical diameter of particles ranging from 300 to 0.1 micrometers.
The new generation SediGraph III Plus combines this proven technique with new technology to deliver reproducible and highly accurate particle size information, completing most analyses in minutes.
Intelligent Design Features
The SediGraph III Plus offers advanced instrumentation features that ensure measurements are repeatable and easy to perform. New features make it easier to operate and maintain the instrument, and the results can be reliably reproduced by SediGraphs in other locations.
Design improvements include:
- High-precision x-ray tube with ruggedized design and extended life
- Windows operating software with Ethernet connectivity provides point-and-click selection, networking, printer selection, cut-and paste, and much more
- Utilization of a simplified pumping system ensures fast and easy maintenance
- Reduced noise level for a quieter working environment
- A maintenance reminder, based on the number of analyses performed, alerts you when it is time for routine maintenance
- Computer-controlled mixing chamber temperature improves repeatability and reproducibility
- A highly versatile and interactive reporting system provides a wide range of custom data presentation options and now includes particle settling velocity and grain size in Phi units
A Wide Variety of Benefits:
Complete particle accountability
Assures that all of the introduced sample is accounted for, including fractions below 0.1 µm
Capability to merge data
With that from other particle sizing methods, thus extending the range of reported data to 125,000 µm (125 mm), excellent for geological applications
Scanning the sedimentation cell
From bottom to top allows accurate inventory of fast-settling particles while minimizing the time required to resolve the separation of fine particles
Fully automatic operation
Increases sample throughput and reduces operator involvement in addition to reducing the opportunity for human error
Temperature-controlled analyses
Assure that liquid properties remain constant throughout the analysis so you can be confident of accurate and reproducible results
Multiple analysis speeds
Allow you to choose the desired combination of speed and resolution that meets your needs
Real-Time display
Allows you to monitor the cumulative mass plot of the current analysis and to make immediate procedural changes if needed
Statistical process control (SPC) reports
Track the performance of your processes allowing immediate response to fluctuations
Plot overlays
Provide a visual comparison of analysis results from one or more analyses; a reference or baseline analysis, for example, or a superposition of two different types of plots of the same analysis data
Data comparison plots
Provide graphical displays of the mathematical difference between two data sets (difference from reference plot) or the extent of a data point value above or below a tolerance boundary (out of specification plot)
Multiple analyzer control
Allows two SediGraph III’s to be operated simultaneously from a single computer, conserving valuable lab space and making data storage convenient
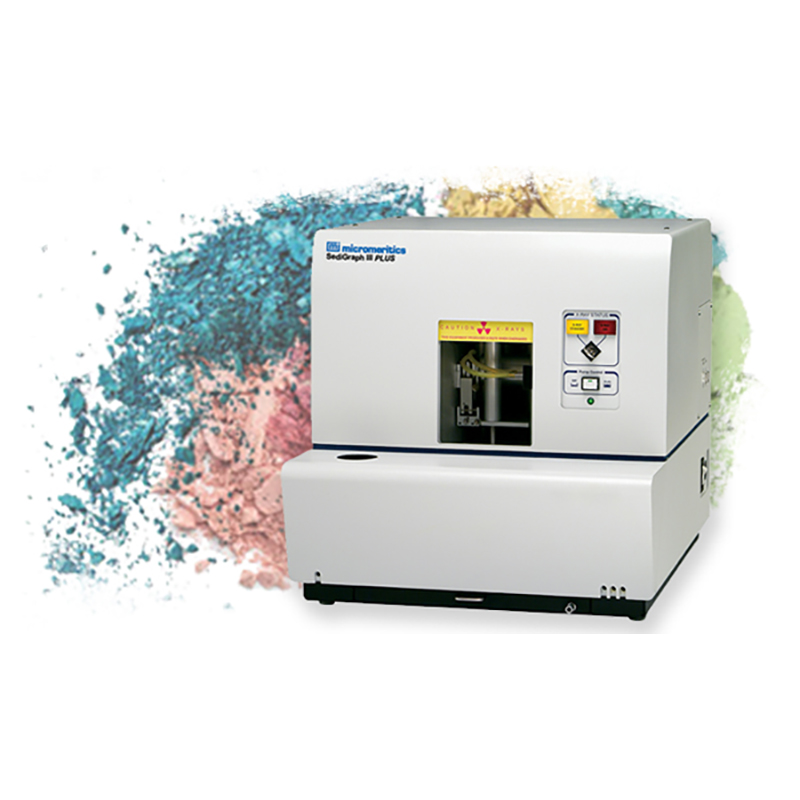
Applications
Ceramics :
The size range of particles and the distribution of mass in each size class strongly affect the ability to sinter a ceramic powder and its forming properties as well as the pore size distribution in the finished product. Particle size distribution information helps determine curing and bonding procedures, control pore structure, ensure adequate green body strength, and produce a final product of desired strength, texture, appearance, and density.
Pigments:
Particle size alone can affect the tinting strength of a color. As tinting strength goes up, the quantity of pigment needed to produce required color intensity goes down. The particle size affects the hiding power of the paints. Also the particle size distribution influences gloss, texture, color saturation and brightness.
Geological/Soil Science:
Grain size affects the moisture-holding capacity of soil, drainage rate, and the soil’s ability to hold nutrients. Grain size is directly related to transport of sediment.
Cosmetics:
The appearance, application, and packaging of cosmetics are influenced by the particle size distribution of base powders, such as talc, and the pigments used for coloring.
Metal Powders:
By controlling particle size, very specific pore characteristics can be designed into a product. Porosity characteristics often are the key to product performance. Similar to ceramics, the particle size distribution is critical to green body and final product strength and density.
Catalysts:
Particle size affects the catalytic activity of a metal for structure-sensitive catalytic reactions.
Minerals and Inorganic Chemicals:
Reactivity of materials is dependent upon exposed surface area and thus particle size distribution.
Abrasives:
A properly balanced size distribution of abrasive grains and powders is a fundamental consideration whether the material is to be used in slurries, dry blasting, or bonded abrasive tools. Uniform particle size assures precise flow rates through blast machines and is a critical determination in media management when recycling the abrasive material.
Construction Materials:
Particle size of cement affects setting time and strength characteristics of the finished concrete and cement.
The Endurance of the SediGraph Method

The SediGraph has been employed in a wide variety of industrial applications since its embodiment into a commercial instrument in 1967. To confirm its wide use in various applications throughout the world,one needs only to type in ‘SediGraph’as the search key for any Internet search engine.The instrument has undergone many improvements in speed, sample handling,and data reduction and reporting since its introduction. However, the fundamental analytical technique continues to be based on two well-established and well-understood physical phenomena—sedimentation and photon absorption. Stokes’ law is applied to determine particle size by measurement of the terminal settling velocities of sample particles of various sizes. Relative mass concentration for each size class is determined by applying the Beer-Lambert-Bouguer law to the measured absorption of a low-power X-ray beam projected through the fraction of sample remaining in suspension. The elegant simplicity of the Stokes and Beer-Lambert-Bouguer laws means that interpretation of raw data is straight-forward; the analyst easily can understand the relationship between the basic measurements and the reported size distribution. All experimental parameters are easily determined, data reduction is uncomplicated and fast, and there is no requirement to ‘bias’ the data reduction software toward a particular distribution modality.
Stokes’ Law
Stokes’ law simply states that the terminal settling velocity of a spherical particle in a fluid medium is proportional to the square of the diameter of the particle. Stokes’ law applies rigorously providing that a certain relationship between these variables, the particle diameter and the settling velocity, is not violated. Application: if a collection of particles of various diameters is uniformly dispersed in a liquid of density less than that of the particles and then allowed to settle under gravity, it accurately can be predicted when all particles below any given size will have fallen below any given level. The size distribution of the particles can be extracted from this information. For a detailed description of the SediGraph technique refer to ISO 13317-3:2001 Determination of particle size distribution by gravitational liquid sedimentation methods – Part 3: X-ray gravitational technique.
Sedimentation, X-ray Absorption
The SediGraph uses a narrow collimated beam of X-rays to measure directly the particle concentration in the liquid medium. This is done by first measuring the intensity of a baseline or reference X-ray beam which is projected through the cell windows and through the liquid medium prior to the introduction of the sample. A homogeneously dispersed mixture of solid sample and liquid is next pumped through the cell. The attenuated X-ray beam is measured to establish a value for full scale attenuation. Agitation of the mixture is ceased and the dispersion is allowed to settle while X-ray intensity is monitored. During the sedimentation process, the largest particles fall below the measuring level, and progressively finer and finer particles do so until only the finest remain near the top of the measuring cell.
Quality Measurement Results
Critical decisions or conclusions may be based on size measurements, therefore your confidence in the quality of those measurements should be well-founded. Data accuracy is particularly important in research applications. Accuracy describes how closely the measurement agrees with the accepted or ‘true’ value. Repeatability and reproducibility are of equal importance in quality control applications. Repeatability describes the ability to produce the same results over a series of measurements of the same sample. Reproducibility of measurements usually pertains to different instruments in different facilities, an important instrument quality in assuring that each facility will produce equivalent products.
An easy-to-use instrument with the capability to produce precise, repeatable, and reproducible data reliably and automatically at high throughput rates epitomizes the ideal measuring tool. The SediGraph is renowned for repeatability and reproducibility and is used as a quality control instrument in many industries that require consistent product to be produced in every factory location. Likewise, the accuracy of the SediGraph also has earned it a high level of respect. The SediGraph directly measures the X-ray absorption mass of the sample and reports mass distribution – no modeling is required! Many particle size reference materials used to test sizing instruments are qualified by the manufacturer using a SediGraph.
Extremely Versatile Data Presentation and Reporting Software
The SediGraph III 5120 is equipped with a versatile, easy-to-use user interface that provides all of the convenient features you expect from a Windows®-based program.These features include point-and-click menus, customizable reports with your laboratory logo graphic, editable graphs, cut-and-paste graphics and tables, data export features, and more. Custom protocols help plan, launch, and control the analysis and assure that subsequent analyses are all performed in the same manner, regardless of the skill of the operator. You can collect, organize, archive and reduce raw data, and store standardized sample information and analysis conditions for easy access during later applications. Finished reports may be generated to screen, paper, or transferred in a variety of formats to storage devices.
Data Reporting
Detailed analysis data for particles ranging from 300 to 0.1 μm are provided automatically by the SediGraph III. Data collected from other particle size analyses ranging from 125,000 to 300 μm can be combined with SediGraph data, enabling effective reporting for particles ranging from 125,000 to 0.1 μm. That fraction finer than 0.1 μm is also indicated.
In addition to tabular data, different graphical analysis plot types are available including:
- Cumulative Mass, Area, and Number
- Settling Velocity Distribution
- Process Control Charts
- Log Probability
- Baseline/Full Scale References
- Frequency Distribution
- Difference From Reference
- Out of Specification
- Rosin-Rammler
- Regression Analyses
Plots can be over-laid for comparing the results from different samples or for comparing different plot types from the same sample.This allows you to compare analysis results to a standard. Plots can be rescaled to give you the ability to scrutinize closely your graphical data.
A new column has been added to the tables and to the x-axis selection in the graphs that reports size in Phi units, where Φ= -log2 (particle diameter in mm). Also, a column selection for settling velocity (cm/s) is available for tables. The x-axis of plots can be scaled in particle size or settling velocity.The SediGraph is the only automated particle sizing instrument that directly measures settling velocity.
SPC Reporting and Regression Analyses
Statistical Process Control (SPC) reporting provides an easy method for continuously monitoring production processes and reducing response times to deviations from the standard. Regression analyses allow you to determine the relationship between a control parameter, for example, and a measured characteristic of the sample.
Select from 26 axis variables including:
- Mean
- Mode
- Median
- Size at (percentile)
- Standard Deviation
- Coefficient of Variation
- – N σ Size
- + N σ Size
- Skewness
- Kurtosis
- Specific Surface Area
- Cumulative Percent at Size
- Percent Out of Specification
- Full Scale Scan Pump Speed
- MasterTech Stirrer Speed
- MasterTech Stirrer Time
- MasterTech Ultrasonic Probe Time
- Particle Density
- Liquid Viscosity
- Liquid Density
- Three User-defined (External) Parameters